Charts tab
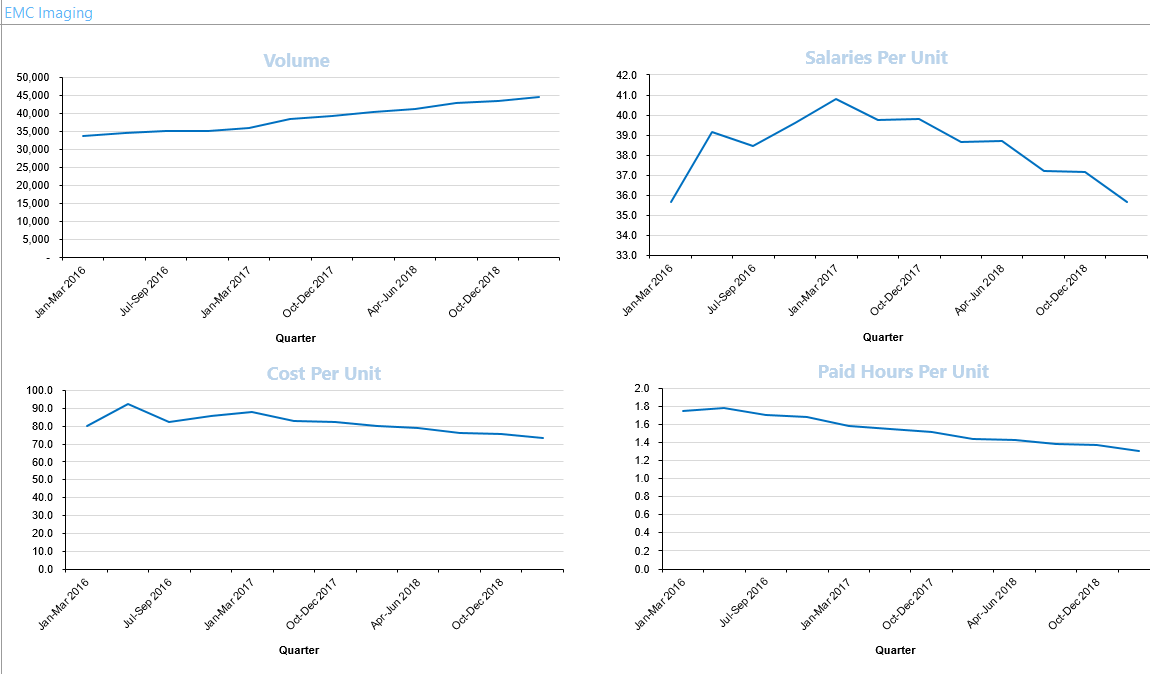
This tab includes a series of graphs illustrating historical and forecasted trends for volume, salaries per unit, cost per unit, and paid hours per unit.
On this page
This tab includes a series of graphs illustrating historical and forecasted trends for volume, salaries per unit, cost per unit, and paid hours per unit.
|
Get more information and training resources: www.kaufmanhall.com |
Was this topic helpful? Charts tab.htm |
